Your entire data stack, in one platform.
Nodeberries is a unified data engineering and analytics platform. Model, ingest, transform, orchestrate, analyse and explore in one connected workspace, with catalog, lineage and governance across all of it.
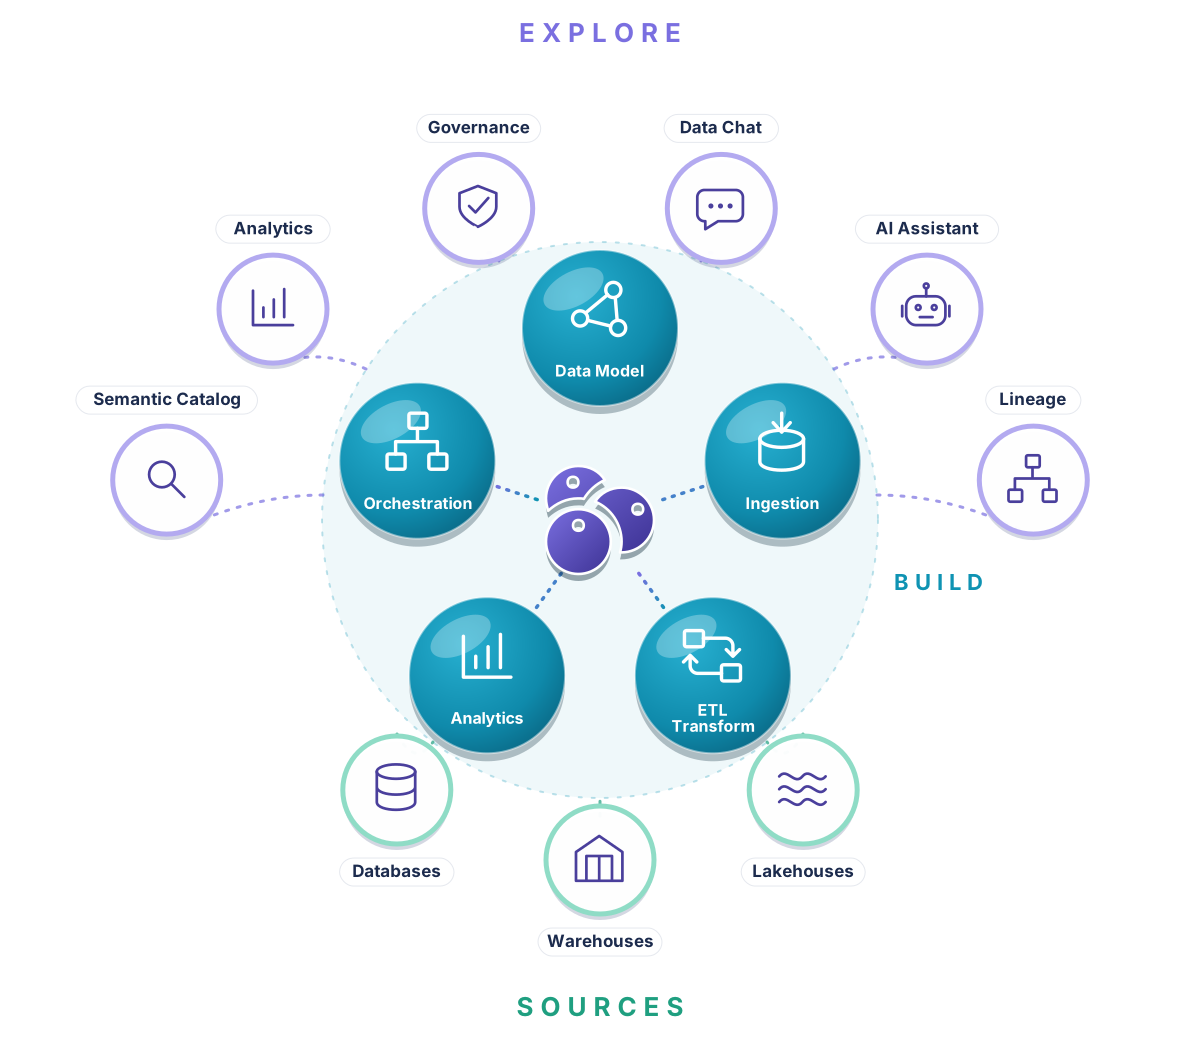
Table 1 · The lifecycle
From source tables to decisions, with one catalog and lineage across every stage.
| Stage | What you do | In code |
|---|---|---|
Model Introspect, or start from scratch |
|
# models/sales/customers.yaml
table: customers
columns:
  - { name: id,     type: bigint, key: pk }
  - { name: email,  type: text }
- { name: region, type: short_text } |
Ingest Simple pipelines |
|
# pipelines.yaml
pipelines:
  - source: public.orders
    target: stage.stg_orders
    mode: incremental
    unique_key: [id]
updated_at_column: updated_at |
Transform SQL jobs |
|
-- jobs/marts/fct_sales.sql
SELECT o.order_date AS date,
       c.region,
       o.amount - o.discount AS net_amount
FROM {{ ref('stg_orders') }} o
JOIN {{ ref('stg_customers') }} c ON c.id = o.customer_id
WHERE o.status <> 'cancelled'; |
Orchestrate Workflows and schedules |
|
# workflows/etl-daily-load.yaml
schedule: { cron: "15 6 * * *", tz: America/New_York }
edges:
- load_orders → dim_date → end |
Analyse Queries, charts, pages, dashboards |
|
-- Daily revenue (certified)
SELECT date, SUM(net_amount) AS revenue
FROM marts.fct_sales
GROUP BY date ORDER BY date; |
Explore Data chat, catalog, lineage |
|
you What are the top 10 customers by revenue? tool query → marts.fct_sales tool 10 rows, masks applied for your role |
Get Nodeberries for your organisation.
Tell us about your organisation. We review every request and reply by email.